Introduction
In the Waterston lab, we study how genes control the embryonic development of the nematode Caenorhabditis elegans. The description below is an introduction for those without experience in developmental biology. If you are an experienced worm biologist, you might find our papers (linked on the left) to be the best introduction.
C. elegans is a remarkable creature that has been the subject of vigorous research in the past three decades. The adult worm is transparent, 1 millimeter long, and has only 959 cells. Unlike other animals, the cell divisions of C. elegans are invariant, so that each time a worm grows from a fertilized egg to an adult, it follows a strict pattern! A map of this lineage, as developed by John Sulston and colleagues, has been useful in describing the genetic mechanisms underlying the organ formation, the wiring of the worms' nervous system and the process of programmed cell death. Through decades of work, countless mutant strains with defects in biological process as widely varied as movement, growth, and mating have been described in the scientific literature. C. elegans was also the first animal genome to be completed. Much of this information is available on WormBase, a clearinghouse of information for researchers.
In order to better understand worm development, we are acquiring a picture of gene expression with resolution on the level of individual cells. We employ a strain of worms in which DNA-binding histones have been labeled with green fluorescent protein (GFP). Using confocal microscopy, we record multiple 3D series of images of these embryos as they develop and make movies in which the nucleus of each cell can be seen as a colored sphere. Using these images, we can retrace each cell's lineage back to their progenitors. Unfortunately, annotating these cell divisions from start to finish is both tedious and error-prone. We have created a software package, StarryNite, that automatically tracks and labels the cells as embryonic development proceeds. A second program, AceTree, facilitates editing and visualization of the data. To monitor the timing of gene activation, we employ RFP-labeled histones whose expression is driven by regulatory elements of interest. These elements are found in and around a gene and drive the expression of that gene in the organism.
The movies and images we have created are stunning to look at and promising as a research tool. They can be accessed through the links to the left.
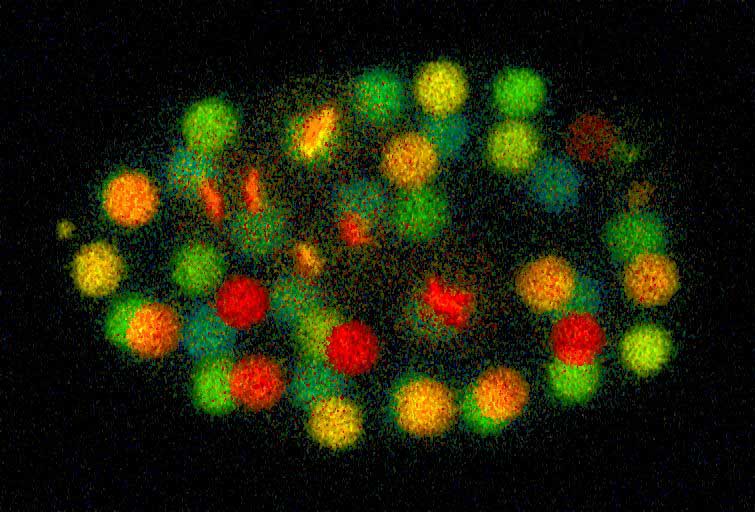
Figure: A depth coded image (red nuclei are closes to the camera and blue nuclei are furthest away) of a worm during gastrulation, a critical period for development. Several of the red-colored cells are in the process of dividing and appear like an 'X' or two parallel bars.